Predicting Reviews on Steam Games via Linear Regression
Purpose
Almost everyone knows that feeling of getting lost in the moment while playing a game and coming back to reality hours later, frustrated and still ready for the next round. Video games are simply an extension of this feeling, made even more engrossing with complex story arcs and gameplays.
In the past decade, online gaming culture in particular has exploded, thanks in part to huge platforms such as Steam. According to Polygon, the site was gaining a million users a month at the end of 2017. With that in mind, I wanted to see if I could find what, if any, non-storyline related factors increase engagement, as measured by number of reviews, using readily available data from Steam for my second project at Metis.
Problem Statement
Can we predict what games would have more reviews based on the number of systems they support, which ones they support, their price, and whether they were on discount?
Approach
Engagement was measured in terms of the number of reviews, with the idea being that writing a review is an indication that someone felt strongly enough about the game to post their opinions of it.
The selected features were taken on Steam’s search page, given that these were the first game specific information that users would see on the site.
It was required that students use regression and gather data via web scraping for this project. I used R2 and Adjusted R2 as my primary metrics for evaluating the different models I made and went with an ordinary least squares (OLS) model.
After doing an exploratory analysis of my models, I ran the regression, analyzed results using residual vs fitted plots (among others diagnostic plots) and adjusted my model accordingly.
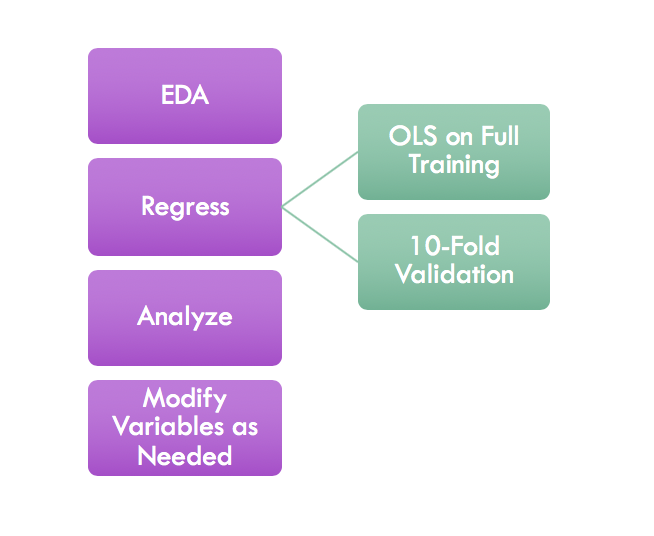
A High-Level Outline of My Process.
Data and Models
I pulled out a simple random sample of 10475 games from Steam’s main search page and ran an iterative regression analysis, as described above. I then split my data into a training set and a testing set, with 30% going to the test set.
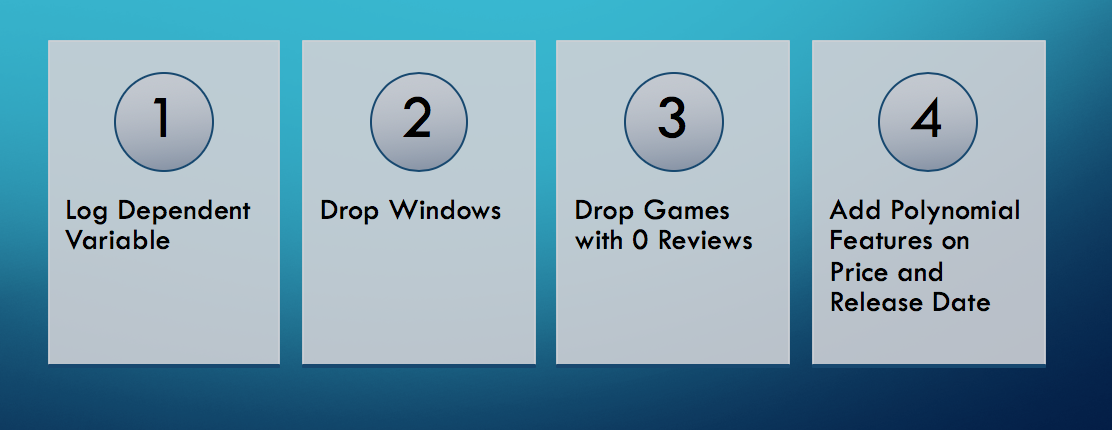
My base model (the training set with all original features) had a poor R2 of 0.068. I attempted multiple scaling/normalization transformation on my variables to obtain a better fitting model. The successful ones were as follows.
Given the small difference in R2 and Adjusted R2, I chose not to regularize the model at this point.
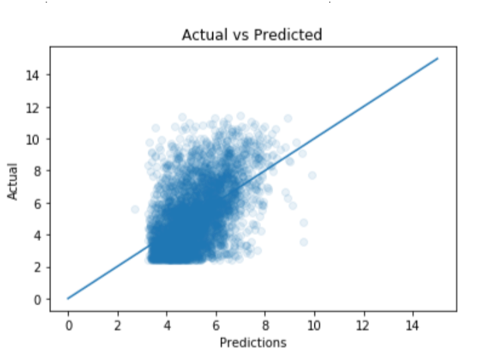
The output of this model on my test set:
After running the regression analysis, I compared the average R2 values of the train and test sets across 10 folds over 9 different models, including regression.
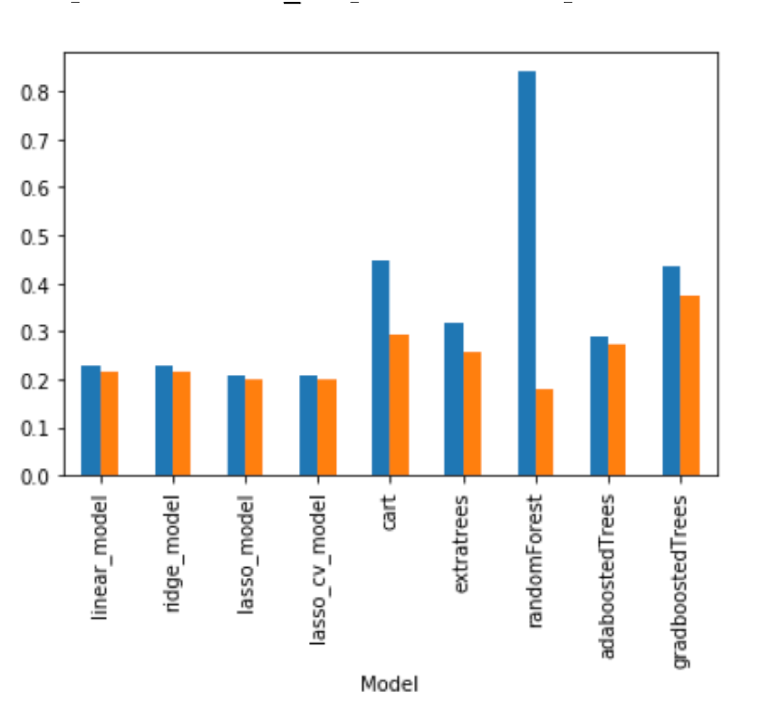
The blue bars represent the average R2 on the train set, while the orange bar represents the same value on the test set.
Results/Conclusions
There are two main factors to keep in mind when choosing what model to use. We want to think about which model minimizes overfitting and how well out model explains variation. I chose to prioritize the latter, and as such my “best” model was gradient boosted trees, even though the height difference between the bars indicated a higher overfit for that model than for some of the others.
This is the model I ran on the holdout test set I had made at the beginning
The final R2 I got on my full train set was 0.4818365496905238 The final R2 on my test set was 0.2066513992465474
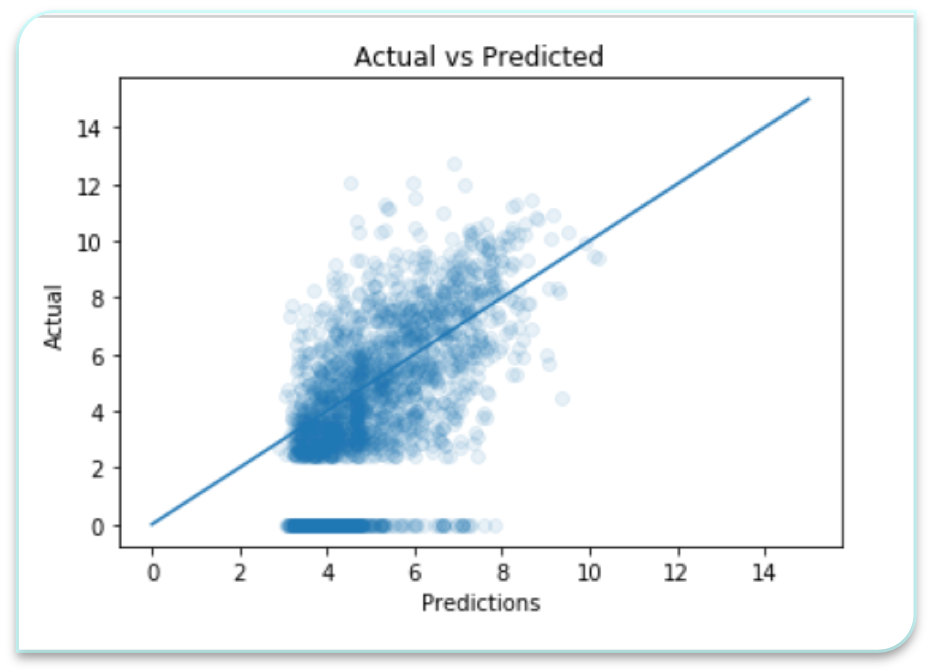
These scores indicate that the model both overfits and has high bias. This implies that the model could use further tuning, or another model should be put into place.
Going Forward
This project was completed over two weeks. If I’d had more time, I definitely would have looked at more features off the game itself. I did a quick scrape of Steam’s individual game pages and pulled out language support, genres, number of players, and other gameplay/content related features. Some other features to look at are developer size and social net spread.