Maximizing Engagement for Women Tech Women Yes' Annual Gala
Purpose
In the first week, we did a project in which we roleplayed as consultants for the fictional organization Women Tech Women Yes (WTWY). WTWY is a New York City based charity that supports women in technology and hosts an annual gala in the last two weeks of July. Invitations for this event are sent to people who register their emails with street team members based at MTA stations
Goals and Methods
Our job was to maximize the number of attendees at this event. We made a profile of our target audience, someone who was interested in tech and/or wealthy enough to spare a donation. The datasets chosen were meant to identify high traffic stations in locations frequented by the targeted groups.
Approach
After obtaining, cleaning, and organizing the data we ran quick visualizations in order to determine the most “valuable” stations for each individual metric. Finally, we inputted each data point for a given station into a weighted formula from which we extracted the top 15 stations. Every dataset either contained or was given a zip code indicator to use as an index.
We determined the weights of each data with the goals in mind, prioritizing engagement over donations.
Data
By order of importance, the data used was:
- Volume of Exits per MTA Station (Exposure): Using the publicly available MTA turnstile data, we were able to determine which stations had the highest number of exits during work hours (6AM-8PM). Because people entering stations likely were on a time crunch as they trains to catch, we believed that looking at exit numbers was more useful. We also searched for the highest volume of exits across stations, although this metric did not factor into our final formula as it was universal to all stations.
+Top 10 Stations
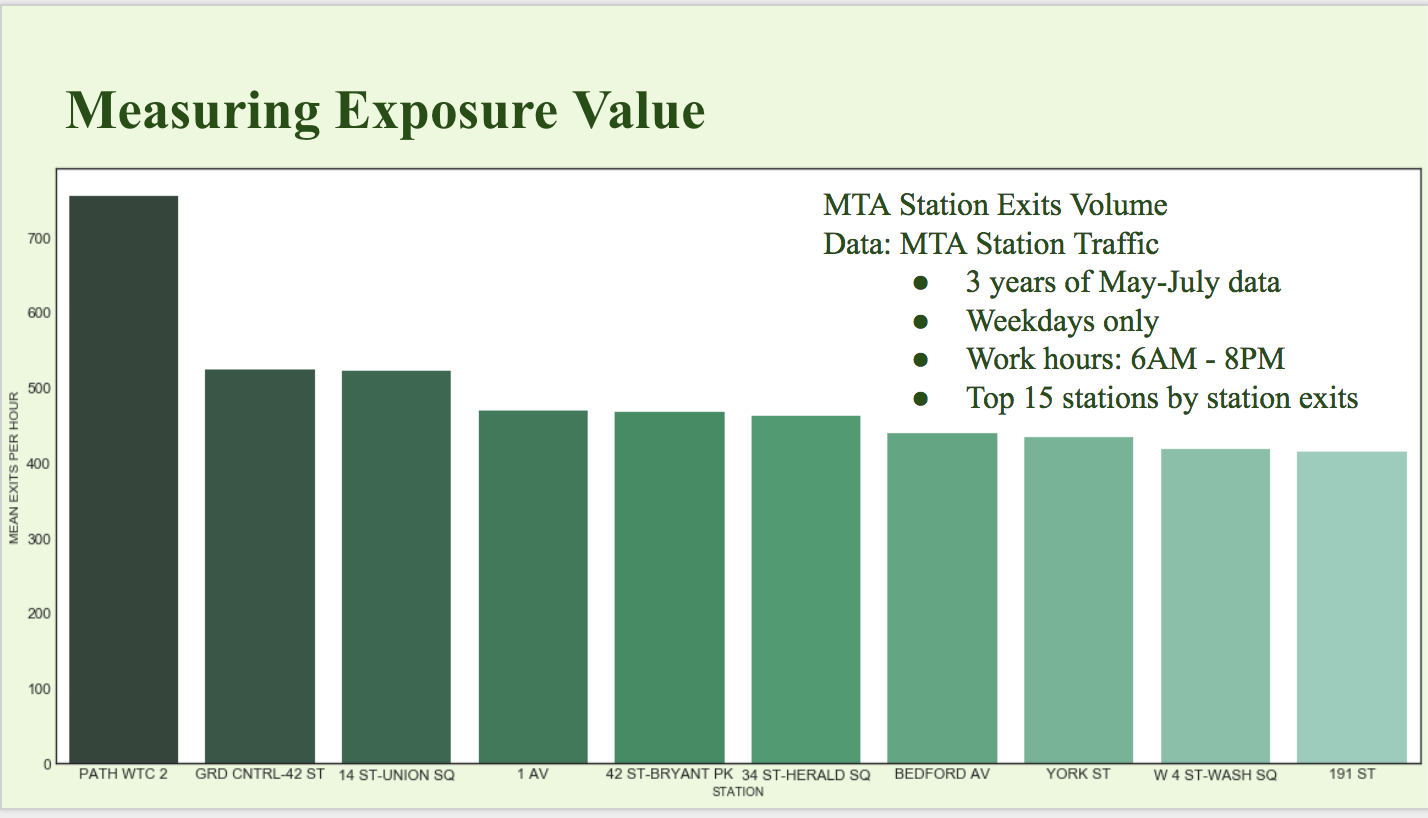 +The time periods with the highest volume of exits over all stations were:
- Late morning, between 9AM and 12PM
- The evening, between 5PM and 8PM
- Tech Company and School Density (Tech Interest): We used Google Maps API to search for large technology companies and universities in New York City. The aim was to find what location had the highest density of these organizations, based on the assumption that students and people working in the tech field would not only be interested in the events themselves, but would also be able to spread word of the gala to other interested parties in their network.
- Top 10 Stations
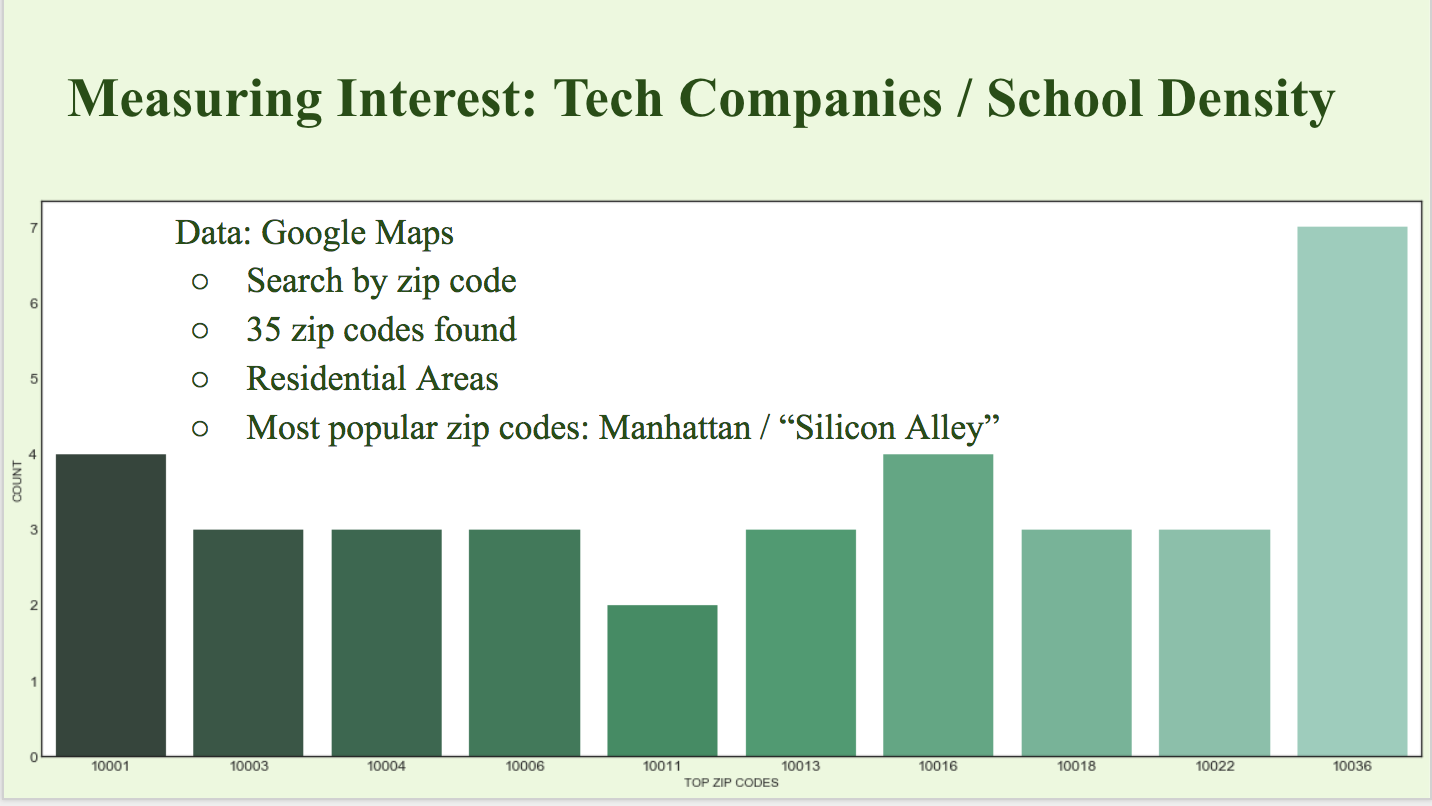
- Top 10 Stations
- Tech Events and Meetups (Tech Interest): The third factor we were interested in was where the greatest number of technology events occurred. For this we again employed the Google API as well as Meetup’s API and ran searches for technology events. Here, the thought was if people were already attending similar events, they were more likely to attend WTWY’s gala.
- Top 10 Stations
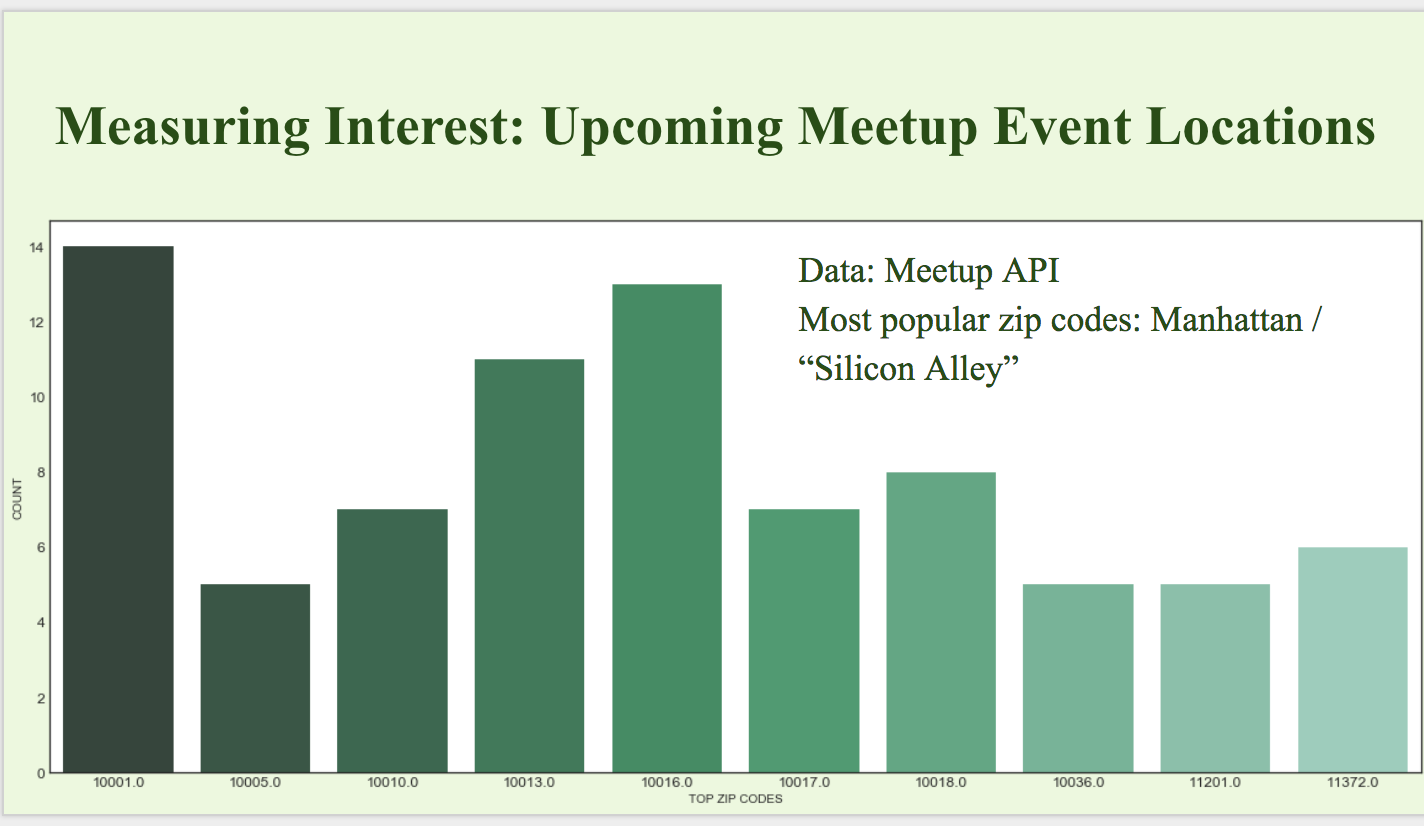
- Top 10 Stations
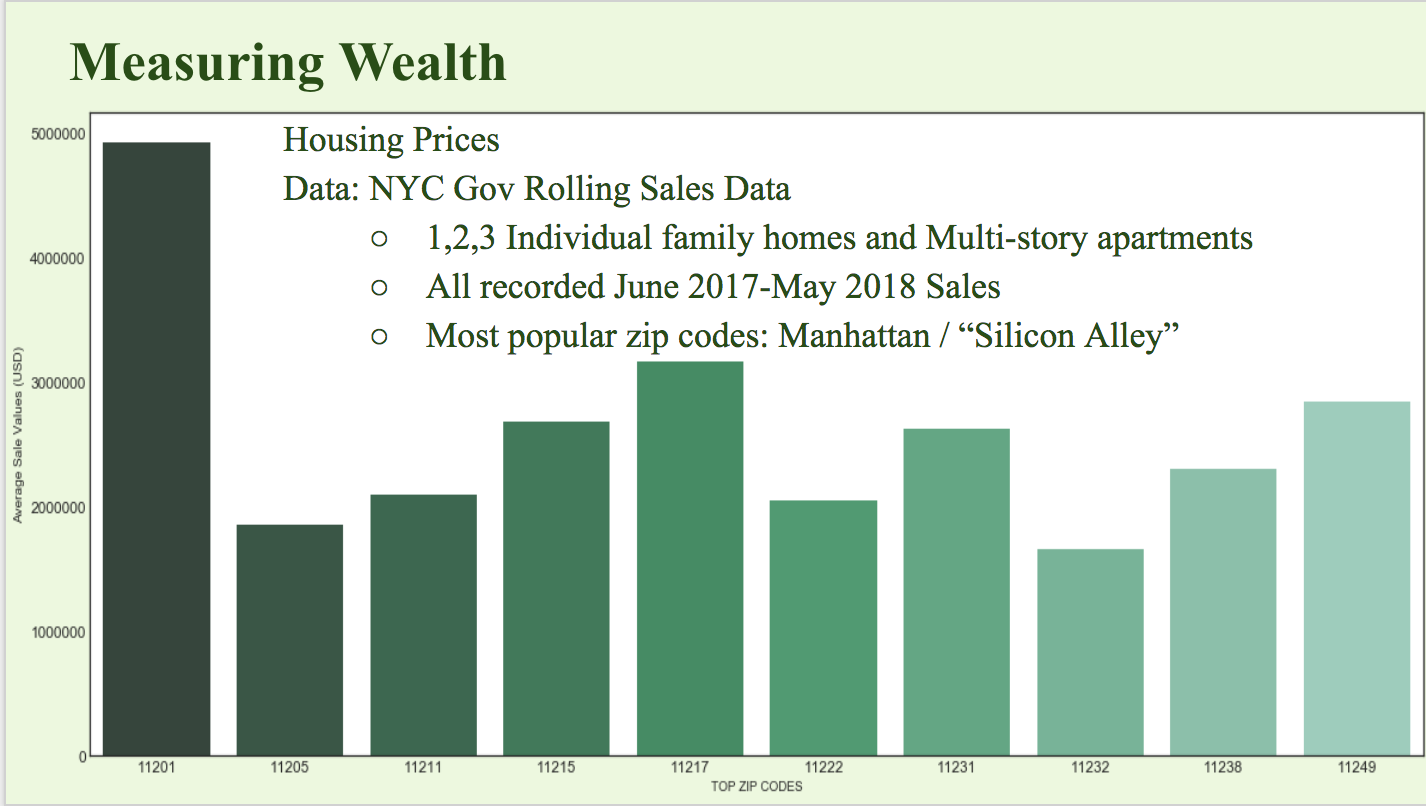
- House Prices (Wealth): Finally, we took a look at the sale prices for all family dwellings and apartment buildings in the city, using open governmental records. This was where we began to think about the people who are likely to donate. We looked at the rent prices in the different boroughs for residential buildings, under the assumption that the people who went through stations in places with higher rent were more likely to have spare income.
+Top 10 Stations
Scoring System
Our Formula was as Follows: +Station Value=f(Exposure Value, Tech Interest, Wealth)=4(Exit Volume)+2(Number of Schools/Companies)+2(Number of Tech Meetups)+1(House Prices)=4(Exit Volume)+2(Number of Schools/Companies)+2(Number of Tech Meetups)+1(House Prices)
Results/Conclusions
Based on this formula, the top 15 stations and their corresponding value counts are as follows:
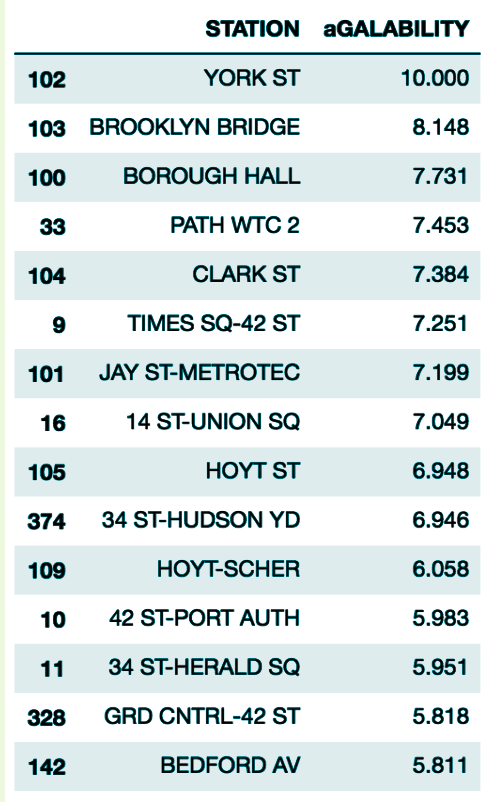
We recommend that WTWY spends the majority of its street team resources on the above stations, and distribute the remainder as they see fit, given the individual data analysis their personal priorities.
Looking Ahead
Were we to have more time, we would have liked to diversify the datasets to include metrics for gender and other income measures. Furthermore, we would want to analyze the individual data to see how that compares to the overall data. This way, we could conceptualize the outcomes of different weighting mechanisms and modify our model in line with WTWYs’ priorities.